
Choose the source
Start with jobs, estimates, invoices, payments, labor, work orders, materials, or another supported record.
Answer recurring shop questions from live records and open the jobs behind each number.
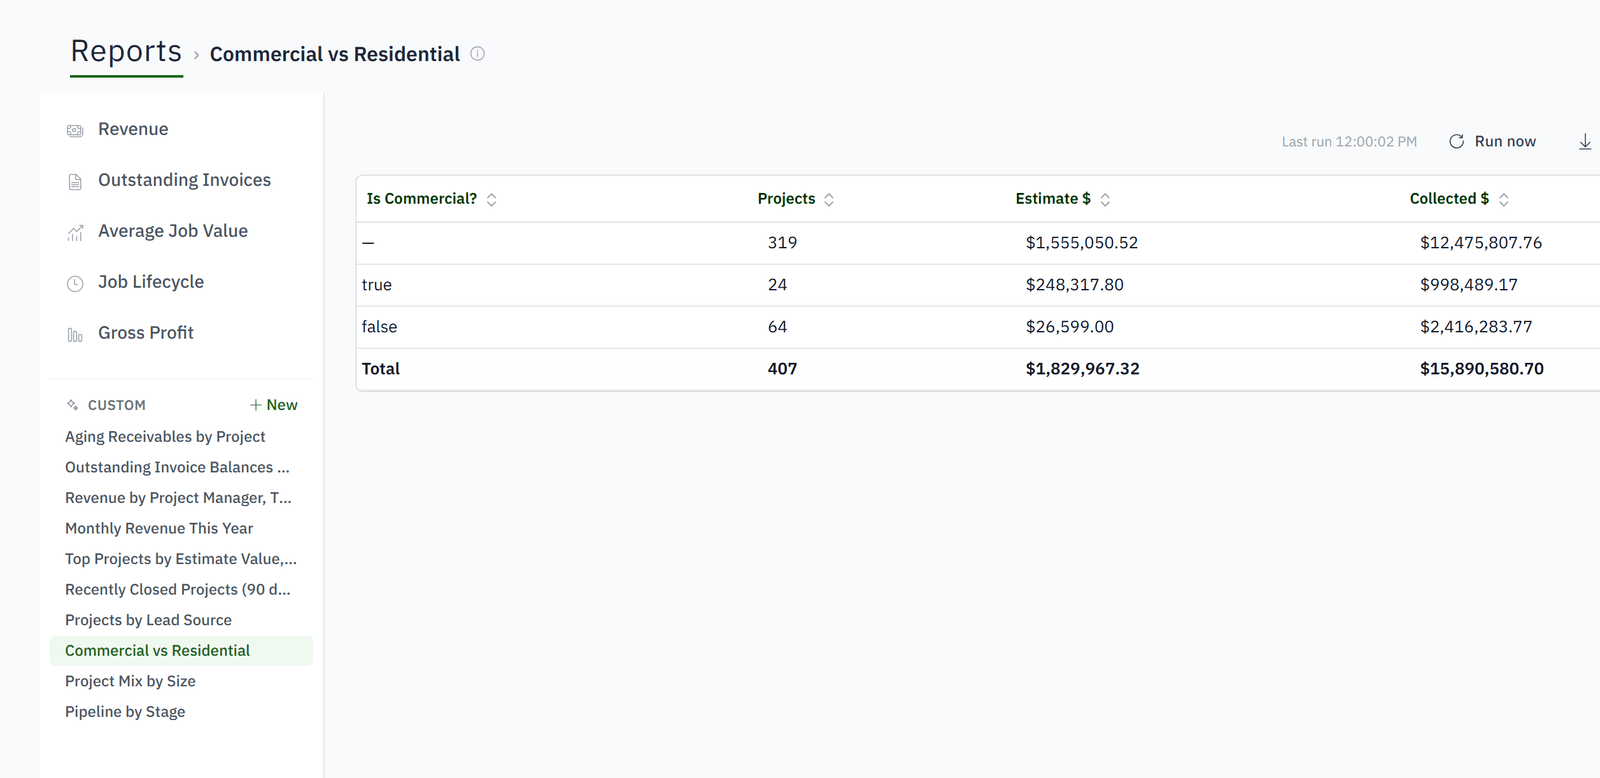
For owners and operations managers who need more than a fixed dashboard.
Exports are stale as soon as they are downloaded.
Custom shop data cannot be grouped cleanly.
A surprising total cannot be traced to its records.
The same spreadsheet is rebuilt every month.

Use current operational data, then move from a surprising total directly into the jobs, invoices, labor, or work orders that produced it.
Start with jobs, estimates, invoices, payments, labor, work orders, materials, or another supported record.
Apply date ranges and value conditions with AND/OR logic.
Group by a useful dimension and count, sum, average, or compare the available values.
Open the underlying records when a total needs explanation or action.
Group live records, compare useful dimensions, and drill into the jobs that produced a result.
Jobs, estimates, invoices, payments, hours, work orders, purchase orders, materials and custom fields.
Each person's own tabbed boards of tiles: the briefing, counts, charts and lists, arranged on a grid. The briefing cannot be removed, everything else can.
A live grid of your jobs with the columns you choose, editable in place, saved and shared by name.
Yes. Every total in a report opens the jobs, invoices or hours that produced it.
Yes. Saved reports rerun against current data, and anyone with the right role can open them.
Owner, admin, manager and office roles. Production users have no reports at all.